AgentCore course → Lesson 5
The quality loop
"How do you know it's any good?" is the question that separates a 200-level AgentCore conversation from a 250-level one. Most people can name the capabilities. Far fewer can describe a closed loop from a production trace to a measured improvement.
Start from what you have
You already know the shape of this problem: agents fail in ways unit tests don't catch, the failure is usually a bad decision rather than an exception, and "it seems better" is how teams ship regressions. You've probably watched someone tune a system prompt by vibes. This lesson is the alternative.
Three capabilities, one loop
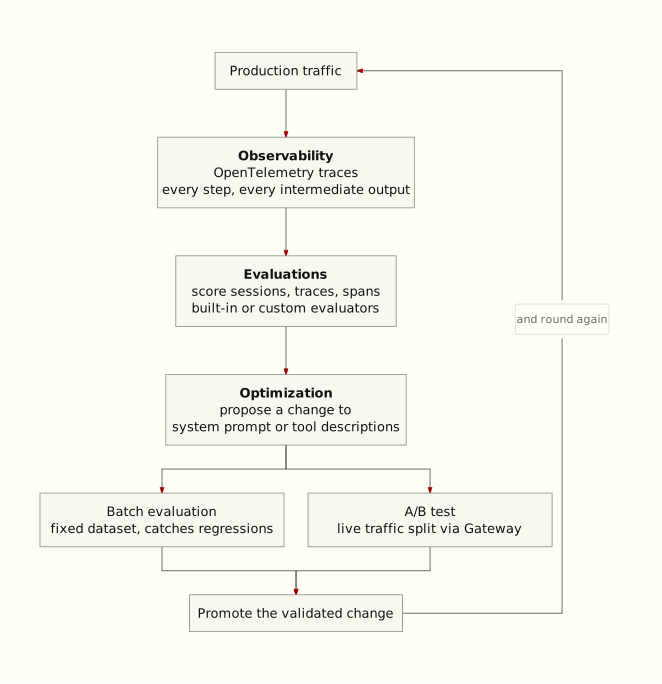
Observability, Evaluations, and Optimization are usually presented as three separate items on a feature list. That framing wastes them. They are one cycle, and the cycle is the thing worth drawing.
The one idea
What makes the loop worth anything is the gate: a proposed change has to pass one before shipping. Traces without scoring is dashboards. Scoring without validation is opinion. The gate is what turns "it seems better" into evidence.
Observability: the substrate for everything else
Observability gives a unified view to trace, debug, and monitor agent performance in production, with detailed visualisations of each step in the workflow so you can inspect an agent's execution path, audit intermediate outputs, and debug bottlenecks and failures. It emits telemetry in standard OpenTelemetry-compatible format and is powered by Amazon CloudWatch.Observability description and OTEL compatibility, AgentCore Developer Guide overview. Retrieved 2026-08-05.
Two things worth pulling out for a customer conversation. First, auditing intermediate outputs is the operationally important part. When an agent reaches a wrong conclusion, the interesting question is which step went wrong, and a final-output log cannot tell you. Second, OTEL-native matters commercially: a startup that already runs Datadog, Grafana, or Honeycomb does not have to adopt a new observability stack to adopt AgentCore. That removes a real objection before it is raised.
It is also where governance evidence lands. Recall from Lesson 3 that every Policy evaluation is logged through Observability, so the audit trail for authorization decisions is the same pipeline as the performance trace.
Evaluations: scoring, at three granularities
Evaluations GA is a purpose-built service for automated, consistent, data-driven agent assessment. It measures how well agents and tools execute tasks, handle edge cases, and maintain output reliability across diverse inputs, and it runs over sessions, traces, and spans generated by Strands Agents or LangGraph and instrumented with OpenTelemetry or OpenInference. Results land in Observability alongside everything else.Evaluations scope, supported frameworks, and instrumentation, AgentCore Developer Guide overview. GA announced 31 March 2026, What's New. Retrieved 2026-08-05.
The three granularities map onto three genuinely different questions, and being able to name which one a customer needs is a 250-level move:
| Granularity | Question it answers |
|---|---|
| Session | Did the agent accomplish what the user came for? |
| Trace | Was the path it took to get there sensible? |
| Span | Was that specific step or tool call correct? |
Note the framework constraint honestly: Evaluations supports traces from Strands Agents and LangGraph. A customer on CrewAI or a bespoke framework can still use Runtime, Gateway, Memory, and Observability, but Evaluations coverage is narrower than the rest of AgentCore's framework neutrality, and it is worth checking rather than assuming.
Cost shape is worth knowing because it differs from everything else in AgentCore. Built-in evaluators bill on tokens, at $0.0024 per thousand input and $0.012 per thousand output, while custom evaluators bill per evaluation at $1.50 per thousand, with the model billed separately. Batch evaluation is cheaper per token than live. So a customer running custom evaluators on every session at scale should model that deliberately; a thousand sessions a day is roughly $45 a month in evaluation fees alone before model costs.Rates from AgentCore pricing. Retrieved 2026-08-10.
Optimization: the part that closes the loop
Optimization Preview is what turns measurement into change. Recommendations analyse production traces and evaluation outputs to optimise your system prompt or tool descriptions for an evaluator you specify. Then two validation paths: batch evaluation tests a recommendation against a pre-defined dataset and reports aggregate scores, catching regressions on cases you already know matter; and A/B tests split live traffic through the Gateway.Recommendations, batch validation, and A/B testing, Introducing the agent performance loop: AgentCore Optimization now in preview, May 2026, and Optimization docs. Retrieved 2026-08-05.
Two details that make this land with an engineer. It optimises tool descriptions, not just prompts. If you have watched an agent pick the wrong tool because two descriptions were ambiguous, you know that is often where the real quality problem lives. And the A/B mechanism is the Gateway, which is the same chokepoint from Lesson 3. The traffic split happens at the governance perimeter, not in application code.
Nothing changes about model weights here. Optimization edits configuration, meaning prompts and descriptions, which is why it is fast and reversible. Avoid the words "tuning" or "fine-tuning"; they will send a technical audience in the wrong direction.
Where Browser and Code Interpreter fit
Both are capability tools rather than quality tools, but they belong in this lesson because they behave like Runtime operationally: they bill on the same $0.0895 per vCPU-hour and $0.00945 per GB-hour meters, and their activity appears in the same traces. When a research agent's bill or latency looks wrong, Browser time is usually the answer, and as the pricing sketch showed, a browsing agent's costs are dominated by Web Search at $7.00 per thousand queries rather than by the browser itself.
A customer proof point worth carrying
The PGA TOUR built on AgentCore to provide coverage for every player in the field, reporting a 1,000% increase in content writing speed and a 95% reduction in costs. AgentCore adds quality evaluations and Policy controls. Retrieved 2026-08-05. Use it as a named reference rather than a metric to promise. The numbers are theirs, for their workload, and a founder will rightly discount them if you present them as typical.
Say this to a customer"You'll get to a working agent quickly. The thing that decides whether it's still working in six months is whether you can answer 'is this better than last week' with evidence. Wire up tracing and scoring before you need them, because instrumenting after a quality problem appears means you've no baseline to compare against."
Be honest about maturity here
Observability and Evaluations are GA. Optimization is preview, with no announced GA date, and AWS's own documentation warns that features and APIs may change before general availability. So the loop is complete in principle but its final link is not production-committed. Say that plainly: recommend building the observe-and-evaluate half now, and treat Optimization as something to pilot rather than to design a roadmap around.
Also: Optimization is free during preview, and you pay only for the underlying capabilities it consumes. That makes it cheap to pilot, which is a genuinely good reason to try it and a better pitch than pretending it is finished.
Read this next: 8 minutes, the best-written of the set
Introducing the agent performance loop: AgentCore Optimization now in preview
The one AWS piece that presents these three capabilities as a loop rather than a feature list, which is the framing you want in your head. It also explains why recommendations target tool descriptions, not only prompts. Retrieved 2026-08-05.
Retrieval practice
Four questions. Two interleave earlier lessons.
-
A customer wants to know whether one particular tool call in a workflow returns correct results. Which granularity?
Answer: B (span level).
-
Where does Optimization split traffic when running an A/B test?
Answer: C (the Gateway).
-
Why does Observability being OpenTelemetry-native matter commercially to a startup?
Answer: A. Their existing stack keeps working.
-
A customer asks which parts of the quality loop they can commit a roadmap to today. What is accurate?
Answer: B. Optimization is the preview one.
Where to go next
You can now describe a closed loop from a production trace to a measured improvement, naming each capability and its maturity honestly. That is the answer to the hardest question a technical founder will ask you.
Lesson 6 covers the newest surface area: harness in depth, Agent Registry, and Payments over x402, plus how to talk about preview services without over-promising.
Supporting cards: the service map for the GA-versus-preview picture, and the pricing cheat sheet for the Evaluations meters.
Questions to take forward
- Show me a custom evaluator, so I can describe one accurately.
- Here is a customer whose agent “sometimes gives bad answers”. Turn that into something measurable.
- What is the smallest useful version of this loop for a ten-person startup?